
Reports & Insights
Survey Reports
View sent surveys, responses, and satisfaction scores in detail, with customizable filtering options.
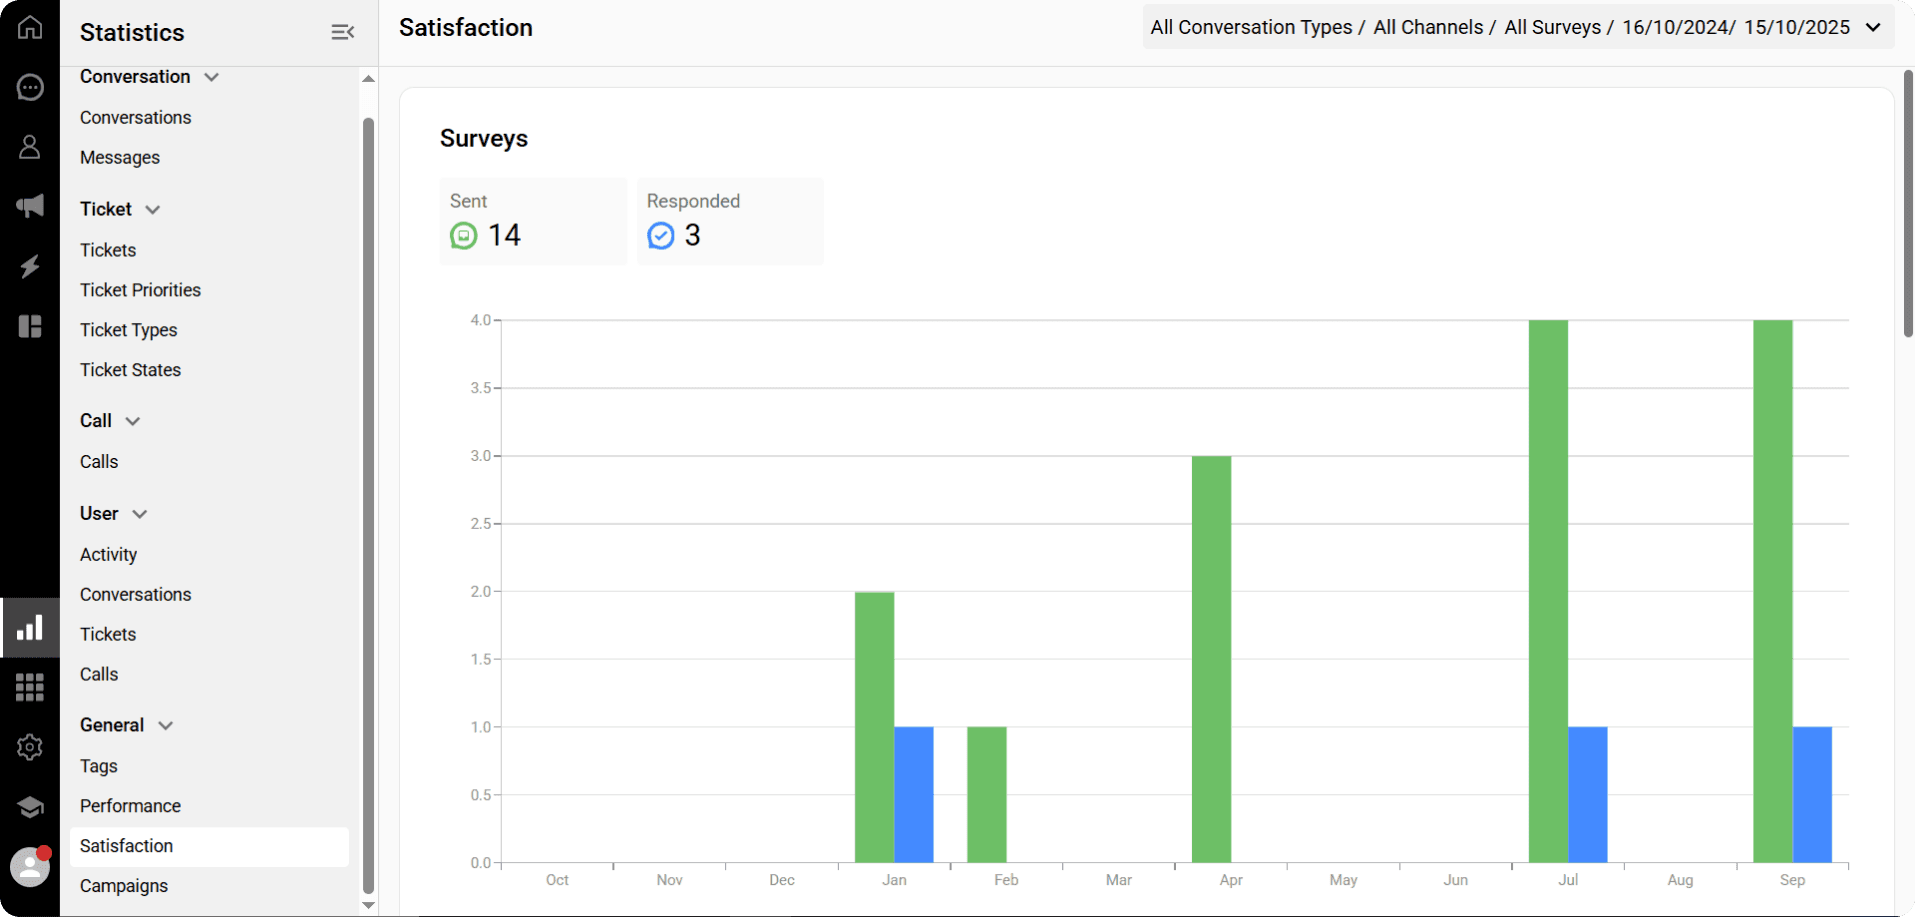
You can view the report showing the number of sent and answered surveys.
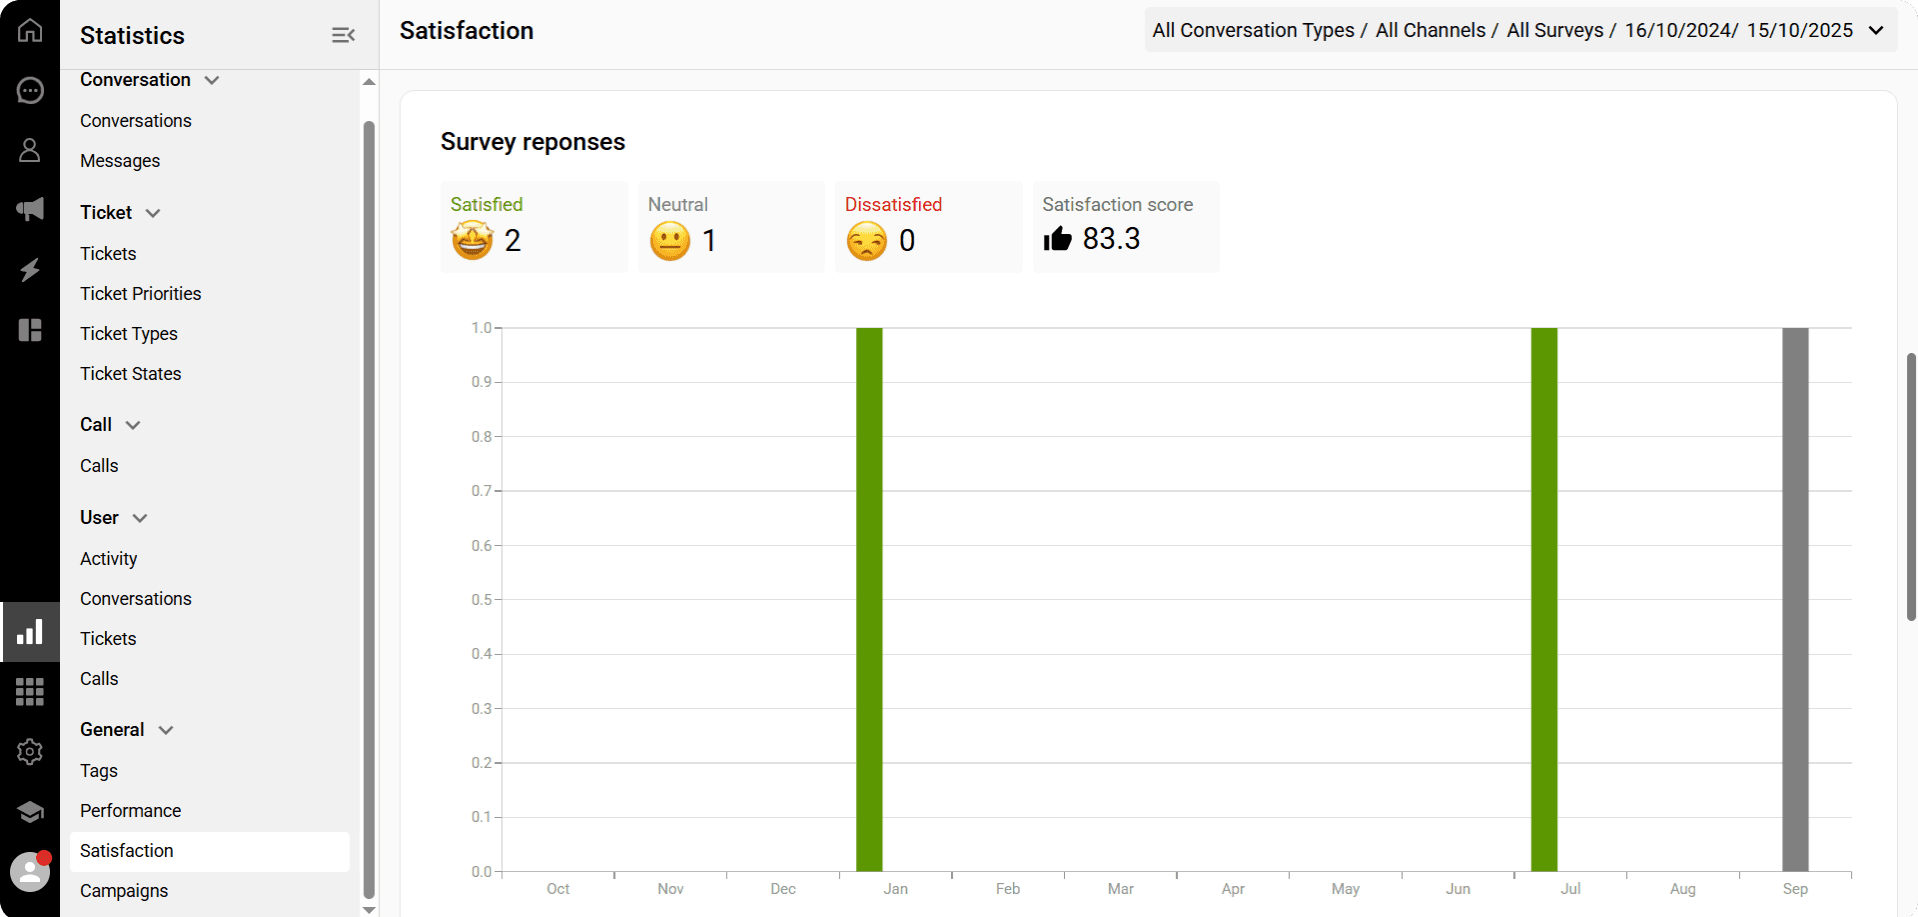
You can see the number of survey responses categorized as satisfied, dissatisfied, and neutral. You can also view a satisfaction score calculated based on these responses.
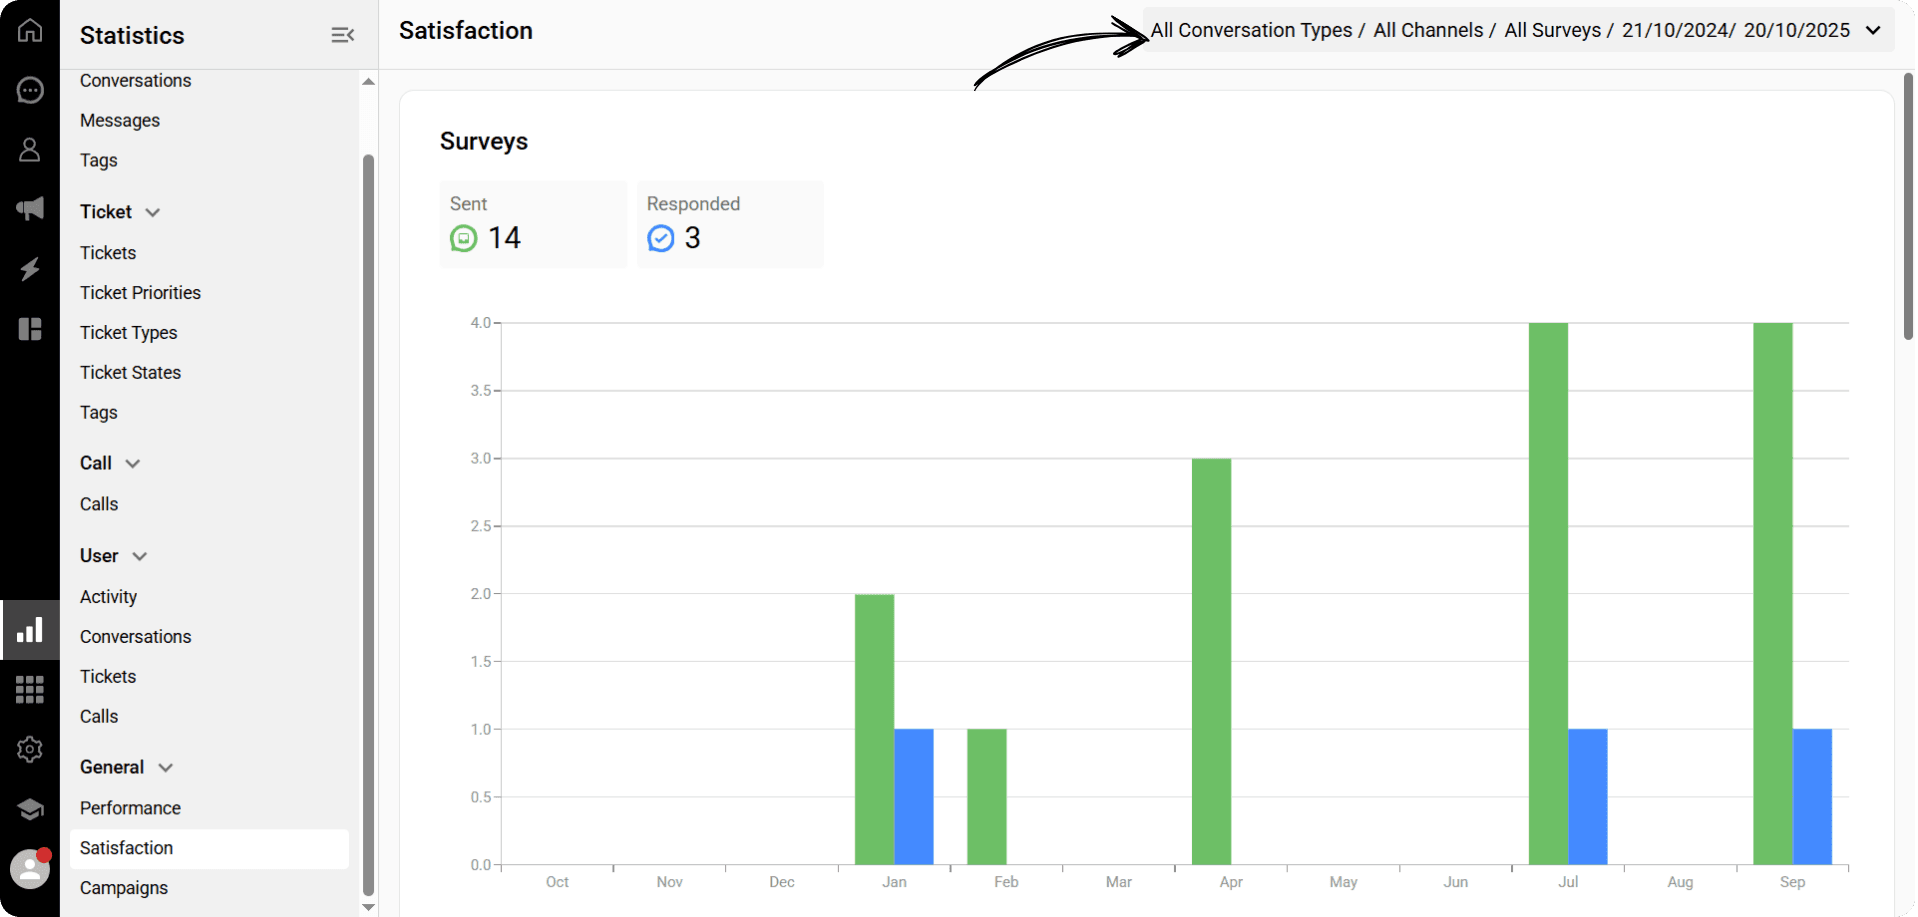
Click the Filter button to filter your satisfaction reports.
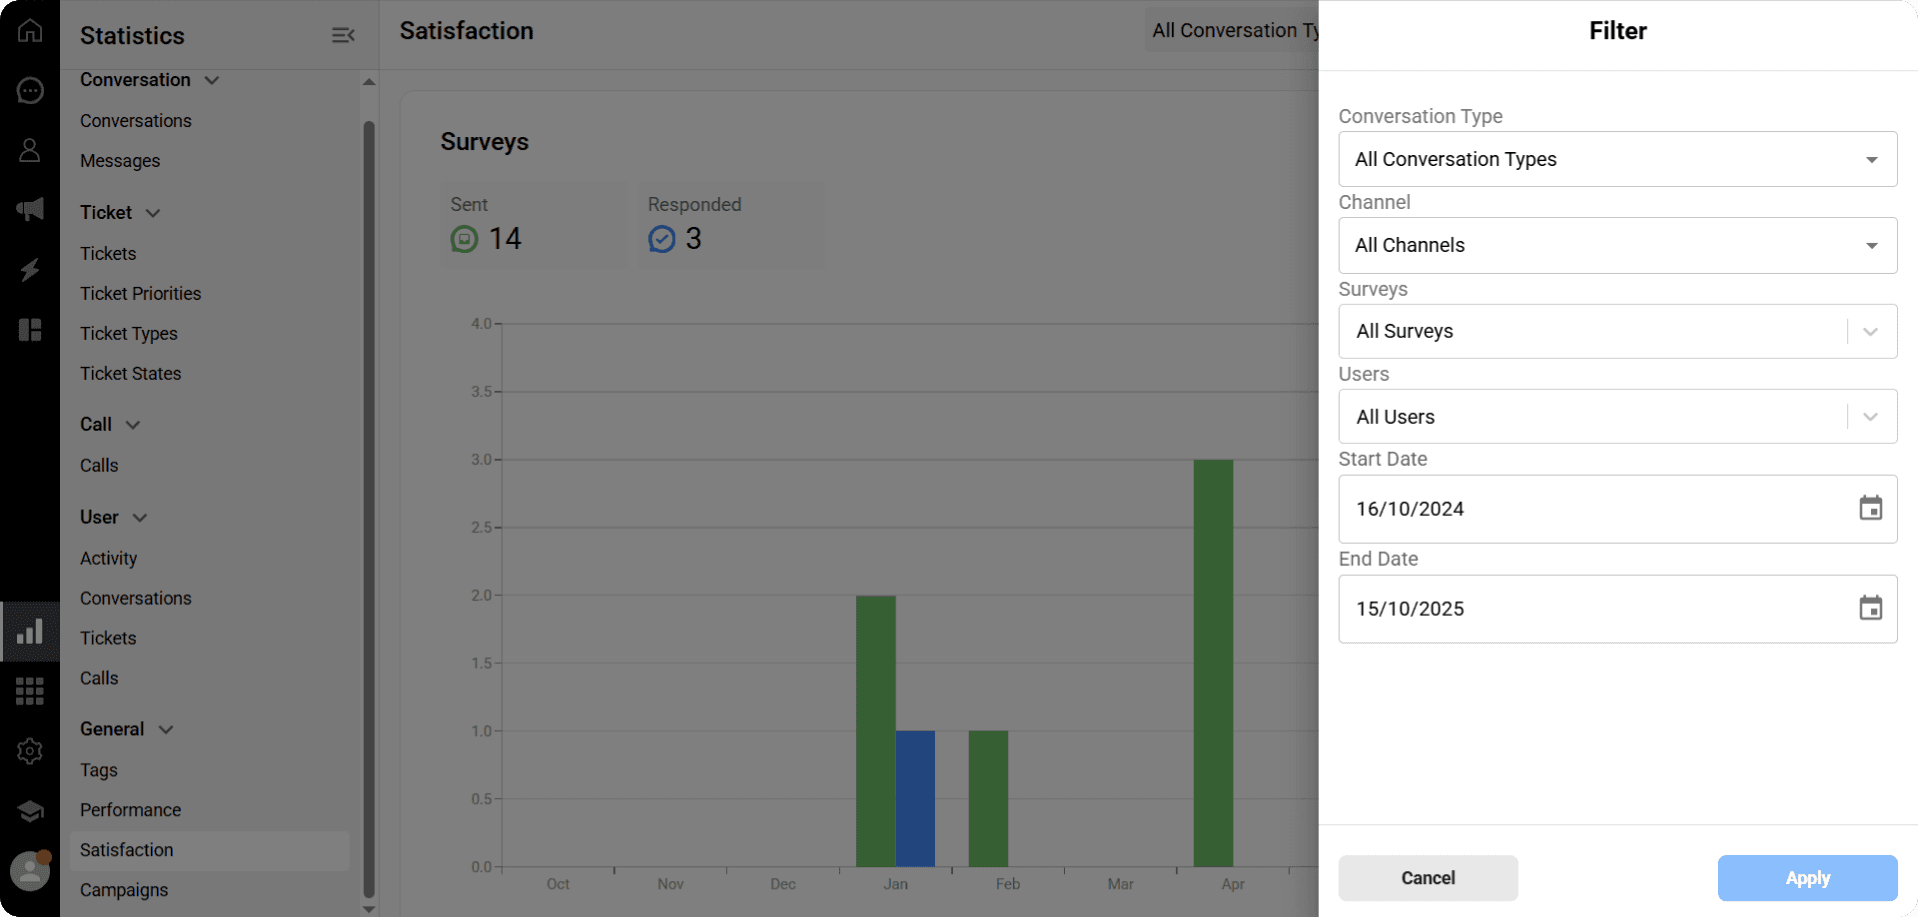
In the filter section, you can select Conversation Types, Channel, Sent Surveys, and Users to generate a report based on the chosen metrics.
You can also adjust the start and end dates of the report.
You can view the report showing the number of sent and answered surveys.
You can see the number of survey responses categorized as satisfied, dissatisfied, and neutral. You can also view a satisfaction score calculated based on these responses.
Click the Filter button to filter your satisfaction reports.
In the filter section, you can select Conversation Types, Channel, Sent Surveys, and Users to generate a report based on the chosen metrics.
You can also adjust the start and end dates of the report.
Previous
Troubleshooting Whatsapp errors
Next
Next
AI Representative (Ticket)
Try Qpien free for 14 days! 🎉
Ready to take control of all your support channels?
Empower your customer interactions with Qpien! Boost sales and elevate satisfaction with every conversation.
Try Qpien free for 14 days! 🎉
Ready to take control of all your support channels?
Empower your customer interactions with Qpien! Boost sales and elevate satisfaction with every conversation.
Try Qpien free for 14 days! 🎉
Ready to take control of all your support channels?
Empower your customer interactions with Qpien! Boost sales and elevate satisfaction with every conversation.